

Maui Hotels Lead State in RevPAR
Maui County hotels led the state overall in revenue per available room at $337, with an average daily rate of $428 and an occupancy rate of 78.6%. The first quarter of 2019 data was compiled in the latest Hawaiʻi Hotel Performance Report published by the Hawaiʻi Tourism Authority.
For the first three months of 2019, Hawaiʻi hotels statewide reported flat average daily rate and lower occupancy, which resulted in lower revenue per available room compared to the first quarter of 2018.
According to the HTA report, statewide RevPAR declined to $236 (-3.3%), with ADR of $292 and occupancy of 80.8% (-2.7 percentage points) in the first quarter of 2019.
Kauaʻi hotels earned RevPAR of $228 (-10.2%), with flat ADR at $305 (+0.2%) and lower occupancy of 74.8% (-8.7 percentage points).
Hotels on the island of Hawaiʻi reported a decline in RevPAR to $225 (-9.7%), due to a combination of decreases in both ADR ($285, -2.0%) and occupancy (79.1%, -6.7 percentage points).
Oʻahu hotels earned slightly lower RevPAR at $196 (-0.9%), with ADR at $236 (+0.8%) and occupancy of 83% (-1.4 percentage points).
For the first quarter, Hawaiʻi hotel room revenues fell by 4.7% to $1.13 billion compared to the $1.18 billion earned in the first quarter of 2018. There were more than 74,300 fewer available room nights (-1.5%) in the first quarter and approximately 190,500 fewer occupied room nights (-4.7%) compared to a year ago (Figure 2). Several hotel properties across the state were closed for renovation or had rooms out of service for renovation during the first quarter.
All classes of Hawaiʻi hotel properties statewide reported RevPAR declines in the first quarter of 2019 except Upper Midscale Class properties ($134, +0.6%). Luxury Class properties reported RevPAR of $452 (-5.4%) with ADR of $594 (-1.2%) and occupancy of 76.1% (-3.3 percentage points). At the other end of the price scale, Midscale & Economy Class hotels reported RevPAR of $155 (-5.0%) with ADR of $187 (-0.5%) and occupancy of 83.1% (-3.9 percentage points).
Comparison to Top US Markets
In comparison to top US markets, the Hawaiian Islands earned the highest RevPAR at $236 in the first quarter, followed by the San Francisco/San Mateo market at $210 (+15.9%) and the Miami/Hialeah market at $208 (-3.5%) (Figure 3). Hawaiʻi also led the U.S. markets in ADR at $292 followed by San Francisco/San Mateo and Miami/Hialeah (Figure 4). The Hawaiian Islands ranked fifth for occupancy at 80.8%, with Miami/Hialeah topping the list at 83% (-2.1 percentage points) (Figure 5).
When compared to international “sun and sea” destinations, Hawaiʻi’s counties were in the middle of the pack for RevPAR in the first quarter of 2019. Hotels in the Maldives ranked highest in RevPAR at $575 (+4.5%) followed by Aruba at $351 (+11.2%). Maui County ranked third, with Kauaʻi, the island of Hawaiʻi, and Oʻahu ranking sixth, seventh and eighth, respectively (Figure 7). The Maldives also led in ADR at $737 (+5.2%) in the first quarter, followed by French Polynesia at $497 (-1.1%). Maui County ranked fifth, followed by Kauaʻi and the island of Hawaiʻi. Oʻahu ranked ninth (Figure 7). Oʻahu trailed Phuket (84.5%, -6.3 percentage points) in occupancy for sun and sea destinations in the first quarter. The island of Hawaiʻi, Maui County and Kauaʻi ranked fourth, fifth and ninth, respectively (Figure 8).
March 2019 Hotel Performance
In March 2019, RevPAR for Hawaiʻi hotels statewide declined to $227 (-4.3%), with ADR of $285 (-1.1%) and occupancy of 79.6% (-2.7 percentage points) (Figure 9).
In March, Hawaiʻi hotel room revenues fell by 5.9% to $373.3 million. There were more than 27,200 fewer available room nights (-1.6%) in March and approximately 66,850 fewer occupied room nights (-4.9%) compared to a year ago (Figure 10). Several hotel properties across the state were closed for renovation or had rooms out of service for renovation during March. However, the number of rooms out of service may be under-reported.
All classes of Hawaiʻi hotel properties statewide reported RevPAR declines in March. Luxury Class properties reported RevPAR of $443 (-7.2%) with ADR of $583 (-3.1%) and occupancy of 75.9% (-3.4 percentage points). Midscale & Economy Class hotels reported RevPAR of $150 (-2.9%) with ADR of $182 (+0.8%) and occupancy of 82% (-3.1 percentage points).
Hotel properties in Hawaiʻi’s four island counties all reported lower RevPAR for March. Maui County hotels reported the highest RevPAR in March at $336 (-1.4%) with ADR of $421 (-1.6%) and flat occupancy (79.8%, +0.2 percentage points).
Oʻahu hotels reported lower occupancy (80.4%, -2.3 percentage points) and flat ADR ($230, -0.2%) for March.
Hotels on the island of Hawaiʻi continued to face challenges in March, with RevPAR dropping 11.2% to $216, ADR to $272 (-4.9%) and occupancy to 79.2% (-5.7 percentage points).
RevPAR for Kauaʻi hotels fell to $213 (-14.6%) in March, with declines in both ADR to $286 (-4.5%) and occupancy to 74.4% (-8.8 percentage points).
More information on this report is available online.
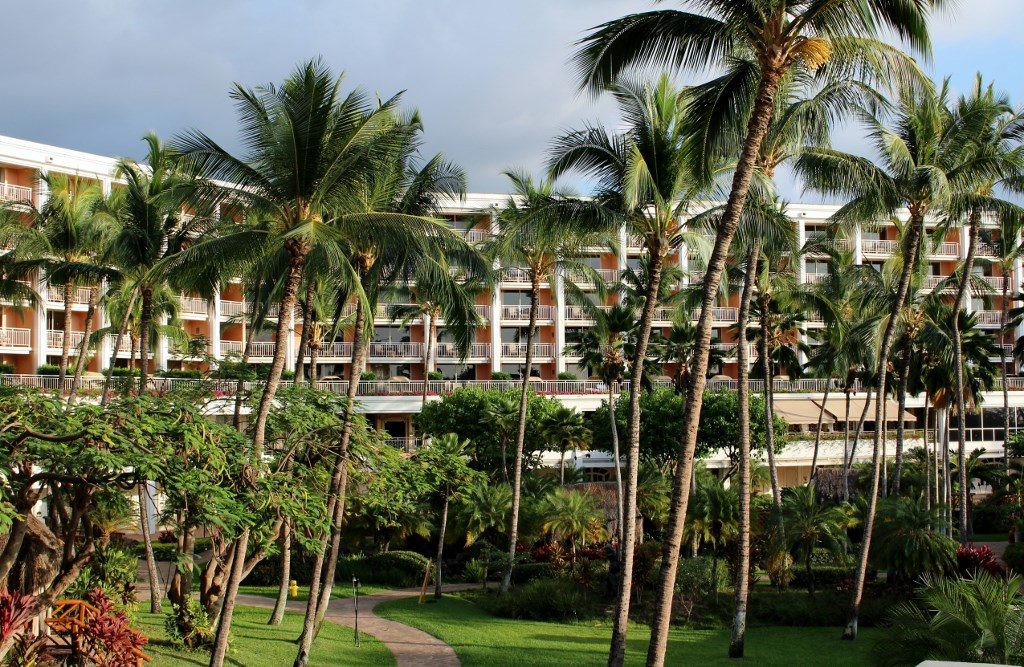
Grand Wailea Resort, Maui. Photo file by Wendy Osher.
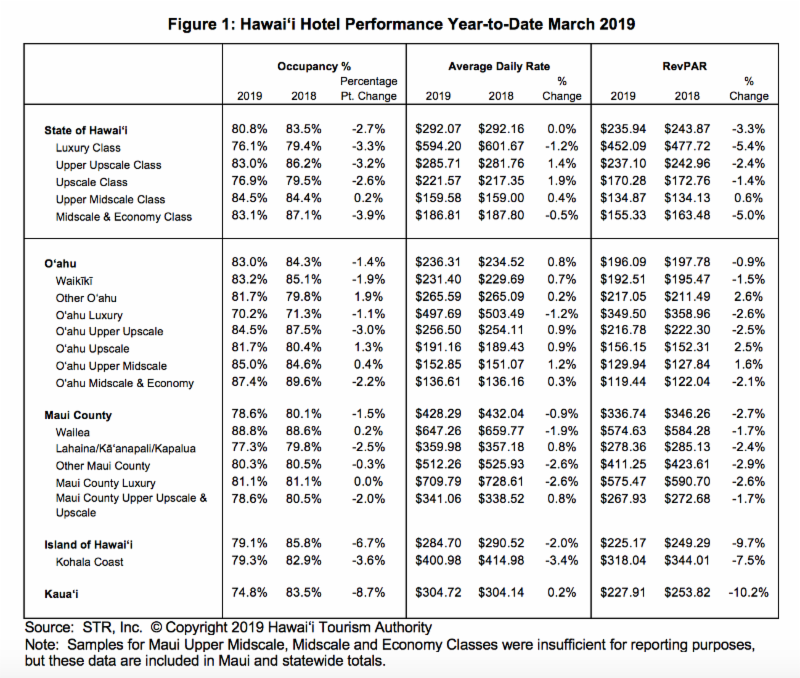
Hawaiʻi Hotel Performance Year-to-Date March 2019. PC: HTA.
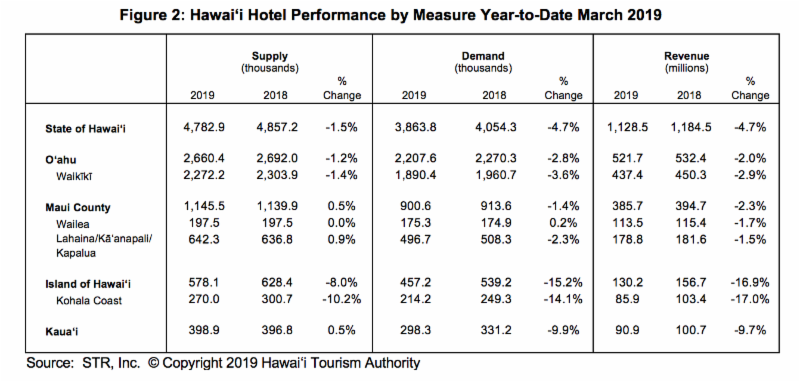
Hawaiʻi Hotel Performance by Measure Year-to-Date March 2019. PC: HTA.
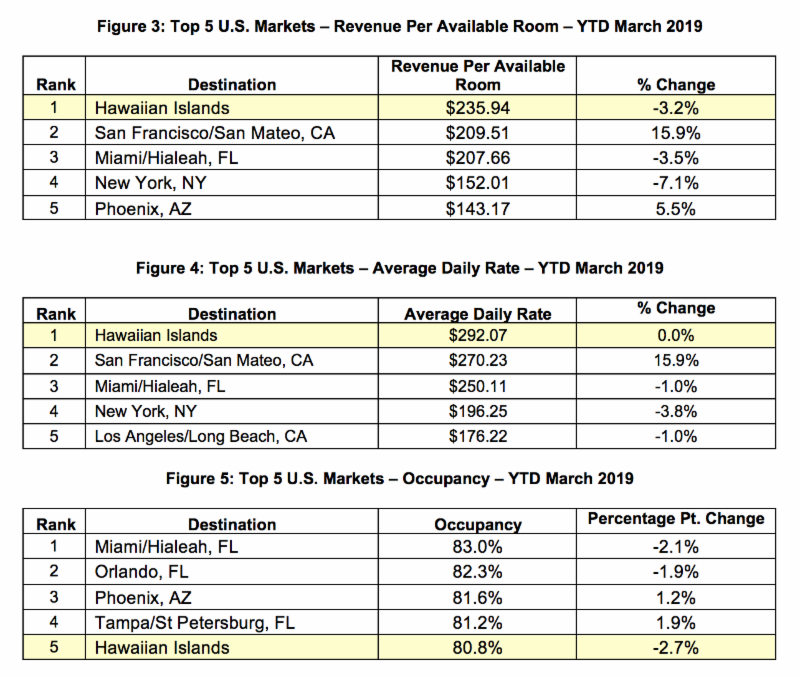
U.S. Markets Data figures 3 to 5. PC: HTA.
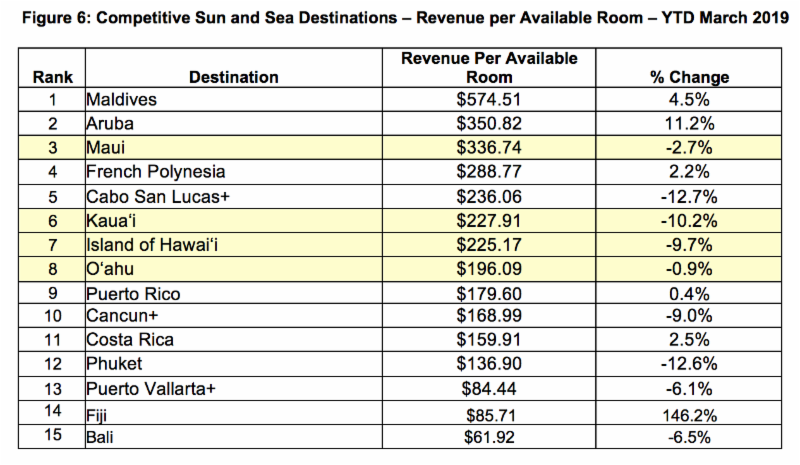
International Revenue per Available Room. PC: HTA.
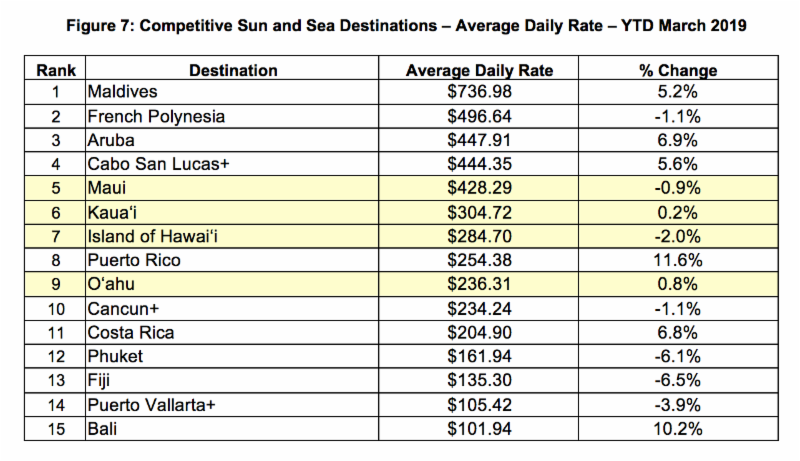
International Average Daily Rate. PC: HTA.
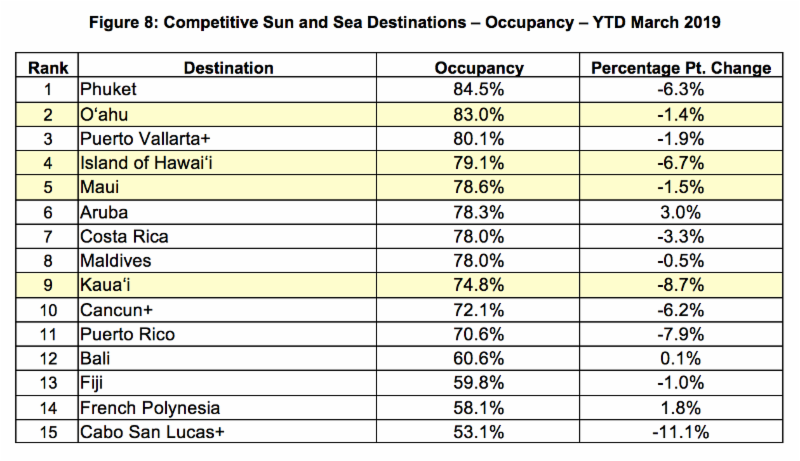
International Occupancy Rates. PC: HTA.
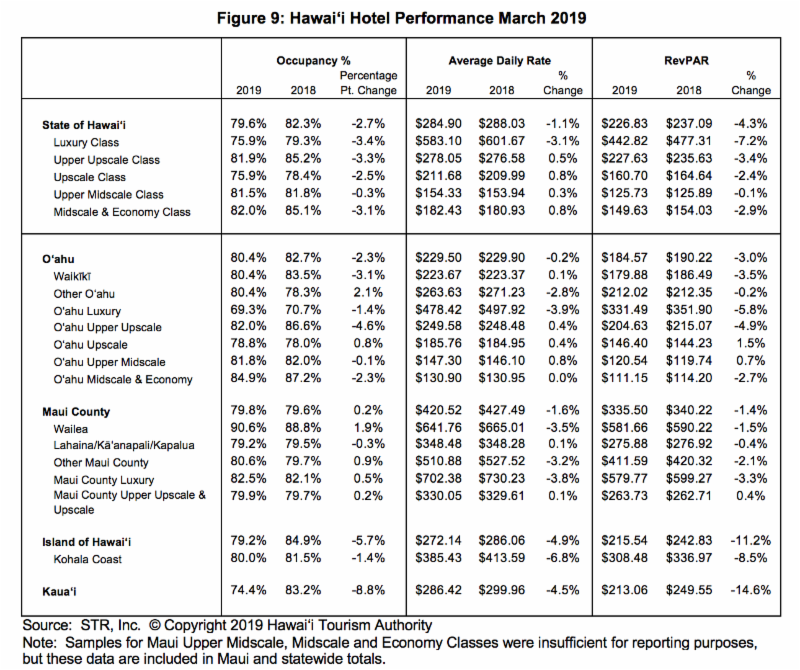
Hawaiʻi Hotel performance in March 2019. PC: HTA.
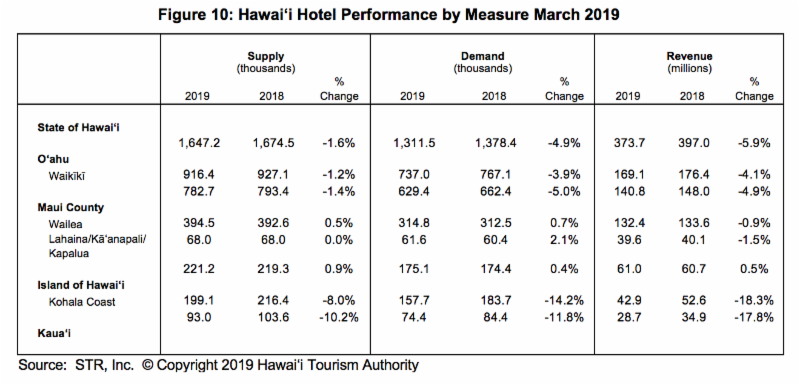
Hawaiʻi Hotel Performance by Measure March 2019. PC: HTA.
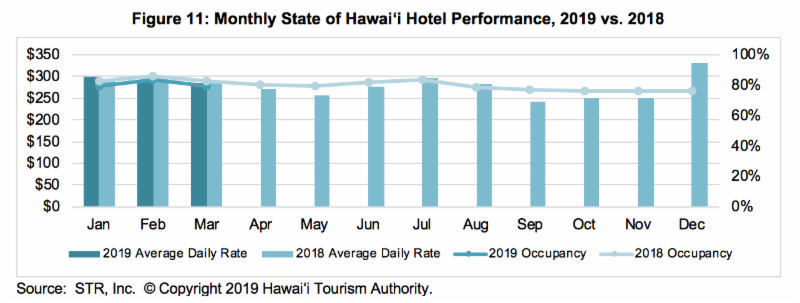
Monthly State of Hawaiʻi Hotel Performance 2019 vs 2018. PC: HTA.
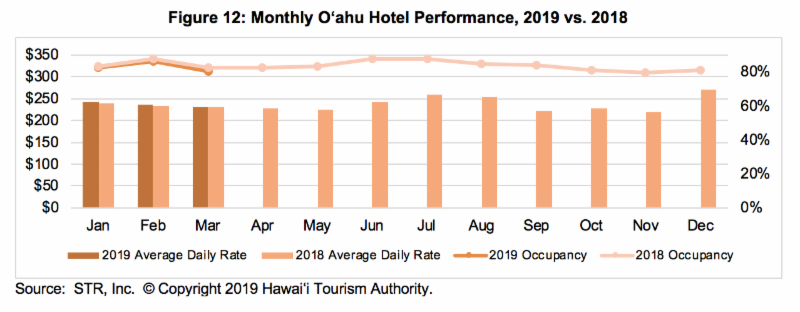
Monthly Oʻahu Hotel Performance 2019 vs 2018. PC: HTA.
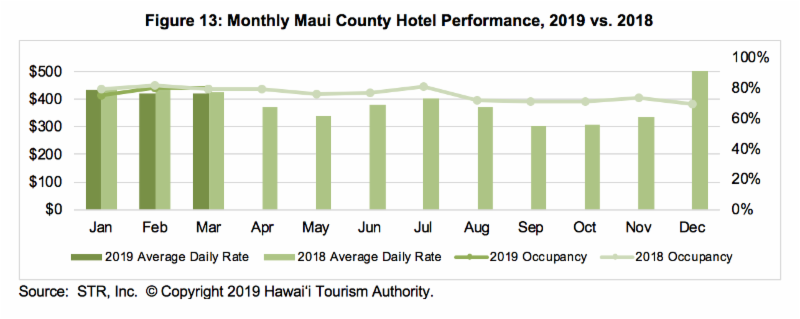
Monthly Maui County Hotel performance, 2018 vs 2019. PC: HTA.
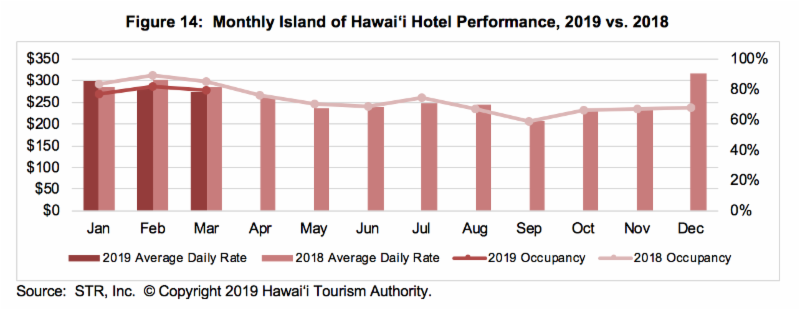
Monthly Island of Hawaiʻi Hotel performance, 2019 vs 2018. PC: HTA.
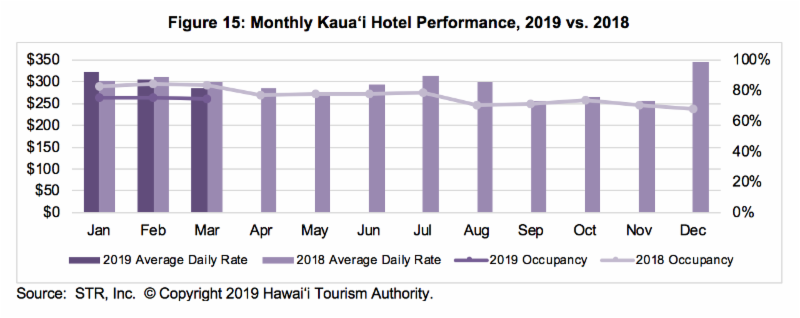
Monthly Kauaʻi Hotel Performance, 2018 vs 2019. PC: HTA.
Sponsored Content