Visitor Statistics on the Rise for Maui, the State

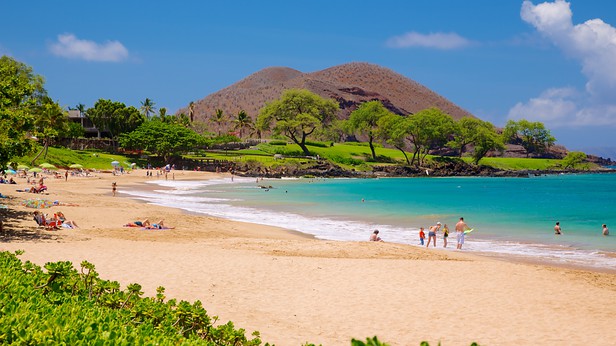
In front of the Makena Beach & Golf Resort (formerly the Maui Prince), Maluaka is one of Makena’s gems. This beach is beautiful and has great snorkeling and swimming. Areas around here are often referred to as Turtle Town Maui. With picnic areas, restrooms, and showers, Maluaka is the best beach Maui has close to the the Makena Beach and Golf Resort. It also has the only beach-entry cruise in south Maui aboard the Kai Kanani. This is the closest departure point if you’re wanting to visit the famous Molokini Crater.
November arrivals to Maui increased 2.8% to 193,355 and visitor days increased by 3.8% in November 2015, compared to last year.
Maui also saw a 7.5% increase in exclusive stay to the island in November.
Visitors to Maui spent $320.4 million, a +5.2% increase over last November, bolstered by higher daily spending (+1.3% to $198 per person).
Growth in arrivals from US West (+3.6%) and US East (+3.8%) offset declines from Japan (-7.9%) and Canada (-3.7%).
Year-to-date, Maui experience a 5.1% increase in visitor arrivals compared to the first 11 months of 2014 and expenditures increased 5.8% to $3.8 billion—all according to preliminary statistics recently released by the Hawai‘i Tourism Authority.
Hawai‘i’s other larger islands realized growth in visitor arrivals in November compared to the year prior: O‘ahu (+4.1% to 407,570), Kaua‘i (+.8% to 83,021), and Hawai‘i Island (+0.5% to 107,558).
Total visitor arrivals to the Hawaiian Islands in November 2015 set a new record for the month with 661,352 visitors, an increase of 3.7% compared to November 2014. November marked the ninth straight month total visitor arrivals have surpassed the previous monthly records.
Visitor arrivals on airlines increased in November 2015 (+4.5% to 657,603), with the balance arriving on cruise ships (-56.4% to 3,749 visitors).
Year-over-year growth in arrivals on airlines from US West (+5.1% to 285,638) and U.S. East (+9.5% to 119,167) more than offset a decrease from Canada (-4.8% to 43,197). Visitor arrivals from Japan (+0.3% to 122,840) were comparable to November 2014, while arrivals from all other international markets increased for the month (+7.3% to 86,761).
Other islands with an increase in exclusive stays on one island were O‘ahu (+6.3%), Kaua‘i (+5.7%), and Hawai‘i Island (+4.7%), compared to November 2014, while fewer visitors (-4%) stayed on multiple islands.
Total visitor expenditures grew in November 2015 (+2.5% to $1.1 billion) compared to the year prior, driven by a 3% increase in total visitor days, which compensated for slightly lower per person per day spending (-0.5% to $196 per person).
Among Hawaii’s top four visitor markets, visitor expenditures increased from US West (+6.6% to $430.7 million) and US East (+7.3% to $254.8 million), but declined from Japan (-7.2% to $174.9 million) and Canada (-12.3% to $80.6 million).
Hawai‘i’s other larger islands saw year-over-year increases in visitor expenditures in November: Kaua‘i (+9.7% to $115.9 million), Hawai‘i Island (+2.6% to $143.4 million), and O‘ahu (+0.7% to $557 million).
There were 927,289 total air seats to the Hawaiian Islands in November 2015, up 4.4 percent from a year ago. Growth in scheduled seats from Canada (+16.9%), Oceania (+8.2%), US West (+5.7%), US East (+4.8%) and Other Asia (+1.2%) offset a 1.8 percent decline in seats from Japan.
Year-to-Date 2015
In the first 11 months of 2015, total visitor arrivals (+4.2% to 7,855,111) and visitor expenditures (+2.2% to $13.6 billion) maintained its positive pace over the same period in 2014. Growth in arrivals from US West (+7%) and US East (+2.8%) offset slightly fewer arrivals from Japan (-0.8%). Gains in US West visitor expenditures (+6.4% to $4.8 billion), counter-balanced a slight drop in US East spending (-0.8% to $3.3 billion) and a decline from Japan (-9.7% to $2 billion). Expenditures of $943.4 million by visitors from Canada in the first 11 months of 2015 were similar to the same period last year.
Year-to-date, the other larger island—Kaua‘i (+4.5%), Hawai‘i Island (+3.9%) and O‘ahu (+2.6%)— experienced growth in visitor arrivals compared to the first 11 months of 2014. Visitor expenditures increased for Maui (+5.8% to $3.8 billion), Kauai (+14.6% to $1.5 billion) and Hawaii Island (+1% to $1.7 billion), but dropped for Oahu (-1.4% to $6.5 billion).
Download the complete November 2015 Visitor Stats Report.
For more information about HTA, go online.


