Volcano Watch: Aftershock forecasts let you know what to expect after a large earthquake
by US Geological Survey Hawaiian Volcano Observatory scientists and affiliates. This week’s article was written by Andrew Michael, a research geophysicist with the USGS Earthquake Science Center.

After damaging earthquakes, response and recovery takes place under the threat of aftershocks. USGS aftershock forecasts can help you understand what may happen, promoting public safety and an understanding that experiencing aftershocks is normal.
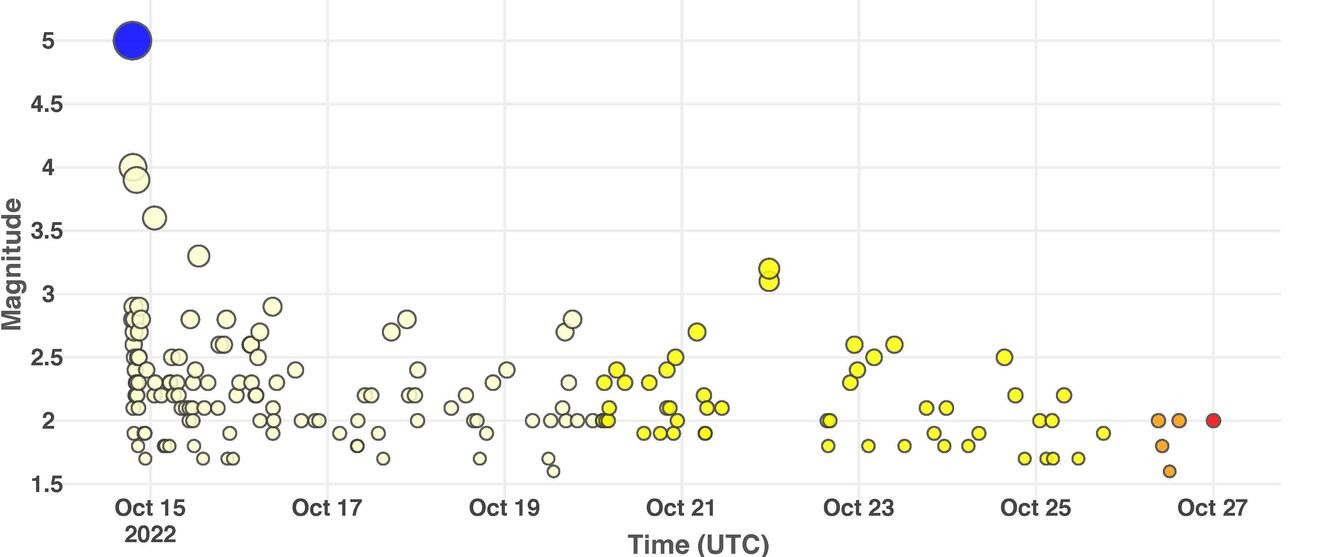
Much about earthquakes is unpredictable but we do know that earthquakes are followed by additional earthquakes, called aftershocks. For instance, in the 10 days after the magnitude 5 earthquake near Pāhala, Hawaiʻi, on Oct. 14, 2022, there have been six aftershocks magnitude 3 and greater, and over 100 magnitude 2 and greater aftershocks within 6.2 miles (10 km). While most aftershocks are smaller than the mainshock, they can still be damaging or deadly and feeling many smaller earthquakes can cause emotional distress. But 5% of earthquakes are followed by a larger earthquake, in which case the earlier earthquakes are referred to as foreshocks and the new largest one becomes the mainshock.
To help people deal with aftershocks, the USGS issues aftershock forecasts for the next day, week, month, and year that provide:
- The expected number of aftershocks that may be felt (magnitude 3 and 4 or greater)
- The probability of aftershocks large enough to potentially do damage (magnitude 5 and greater), and
- The probability of future moderate (magnitude 6) to large (magnitude 7) earthquakes.
These forecasts are automatically issued after most magnitude 5 and larger earthquakes in the United States and its territories. The first forecast is issued 20 minutes after the mainshock and they are updated 74 more times during the first year. Forecasts are updated regularly because the rate of aftershocks changes with time, generally decreasing, although sometimes temporarily increasing after a larger aftershock. Therefore, the forecasts are updated to keep current with the changing aftershock rate. The updates also incorporate information about the behavior of each aftershock sequence.
In addition to providing basic information about an earthquake and its aftershocks, the USGS reminds everyone to “Drop, Cover, and Hold On” during an earthquake. And remember, if you feel a strong earthquake while at the beach or in a low-lying area, you should immediately move to higher ground—a tsunami wave can come ashore before warning sirens can alert you to the potential danger.
The forecasts can be found online at earthquake.usgs.gov by finding the “event page” for the mainshock. For instance, the event page for the Oct. 14 event near Pāhala is here, and the aftershock forecast can be found by clicking the “card” labeled “Aftershock Forecast.” The event page also provides estimates of the shaking and damage due to the earthquake, other technical information, and you can contribute your experience during the event. Recent mainshocks will be found in the list of significant earthquakes on the homepage, older ones can be found in the significant earthquakes archives, and all events can be found by using the search tool.
The aftershock forecasts combine three well-studied statistical properties of aftershock sequences: larger mainshocks produce more aftershocks, smaller aftershocks are more common than larger ones, and the rate of aftershocks declines about in proportion to the time that has passed since the mainshock. The initial forecasts use parameters for that region or similar geologic regions around the world. For instance, in Hawaii the initial forecasts use observations from similar oceanic volcanoes around the world. Those parameters are then updated as we observe the specific behavior of each aftershock sequence.
You may have also noticed that the word most (it was in bold italics!) in the description of when we automatically issue aftershock forecasts. The exception to the rule is earthquakes in Hawaii because volcanic earthquake sequences driven by changes in magma movement or eruptions are far more complicated than can be described by the three simple aftershock properties described above. After magnitude 5 or greater earthquakes in Hawaii, the USGS aftershock forecasting team manually triggers the forecasts if the USGS Hawaiian Volcano Observatory scientists conclude that the sequence is likely to be a simple aftershock sequence. For the October 14 earthquake, that process meant that the first forecast wasn’t issued until 3 hours after the magnitude 5 earthquake occurred. But that delay gave us confidence in the forecasts and, so far, they have been accurate.
Learn more about the USGS aftershock forecasts here.
Volcano Activity Updates
Kīlauea volcano is erupting. Its USGS Volcano Alert level is at WATCH
Over the past week, lava has continued to erupt from the western vent within Halemaʻumaʻu crater in Hawai‘i Volcanoes National Park. Sulfur dioxide emission rates remain elevated and were last measured at approximately 700 tonnes per day (t/d) on Oct. 22. Seismicity is elevated but stable, with few earthquakes and ongoing volcanic tremor. Over the past week, summit tiltmeters recorded several deflation-inflation (DI) events.
Mauna Loa is not erupting and remains at Volcano Alert Level ADVISORY. This alert level does not mean that an eruption is imminent or that progression to an eruption from the current level of unrest is certain.
This past week, about 130 small-magnitude earthquakes were recorded below the summit and upper elevation flanks of Mauna Loa—the majority of these occurred at shallow depths less than 15 kilometers (9 miles) below sea level. Global Positioning System measurements show continued ground deformation consistent with inflation of a magma chamber beneath the summit. Gas concentrations and fumarole temperatures at both the summit and at Sulphur Cone on the Southwest Rift Zone have remained stable over the past week. Webcams show no changes to the landscape.
There were 2 events with 3 or more felt reports in the Hawaiian Islands during the past week: a M3.3 earthquake 9 km (5 mi) E of Pāhala at 31 km (19 mi) depth occurred on Oct. 23 at 10:44 p.m. HST and a M2.5 earthquake 3 km (1 mi) NNW of Pa‘auilo at 0 km (0 mi) depth occurred on Oct. 20 at 3:26 p.m. HST.
HVO continues to closely monitor Kīlauea’s ongoing eruption and Mauna Loa for any signs of increased activity.
Sponsored Content