Volcano Watch: Inflating volcanoes or cloudy data; discerning deformation from noise

Today’s article was written by Logan Fusso, a geophysicist with the Hawaiian Volcano Observatory.
Satellites have become one of the fundamental tools used to monitor active volcanoes. They allow us to monitor volcanoes that are otherwise hard to access and provide perspectives that are not possible to get from the ground. Satellites orbiting the Earth can provide normal “pictures” of a place, but can also provide thermal images, measure amounts and types of gases, changes in gravity, and topography.
One of the most revolutionary advances has been the use of InSAR (Interferometric Synthetic Aperture Radar) to measure small changes in shape over an entire volcano. As discussed in a previous “Volcano Watch,” Synthetic Aperture Radar satellites send timed radar waves that bounce off the Earth back to the satellite.
It takes two sets of waves of the same area to measure change over time. If there has been no change to the volcano for the time between images, the signals will travel the distance in the same amount of time. However, if the volcano has changed by either inflating (uplift) or deflating (sinking), the volcano will be closer or further away in the second image. It will take more time for the radar wave to travel the distance from satellite to the ground, then back to the satellite.
If the difference between two offset waves are assigned a color based on the size of the offset, they produce a unique set of banded colors that represent the number of wavelengths separating the two images. This process produces images called interferograms. Concentric rings of color relate to the amount of surface inflation or deflation of a volcano.
While InSAR is useful for monitoring volcanic motions, it is not without problems. The nature of how InSAR images are gathered from a radar satellite often unintentionally captures signals associated with the changes in the Earth’s atmosphere between satellite passes in addition to ground surface change. This additional “atmospheric noise” is especially apparent with changes in topography. At active volcanoes that are very tall, like Mauna Loa, the sloping flanks can magnify atmospheric signals, falsely suggesting that significant change has occurred.
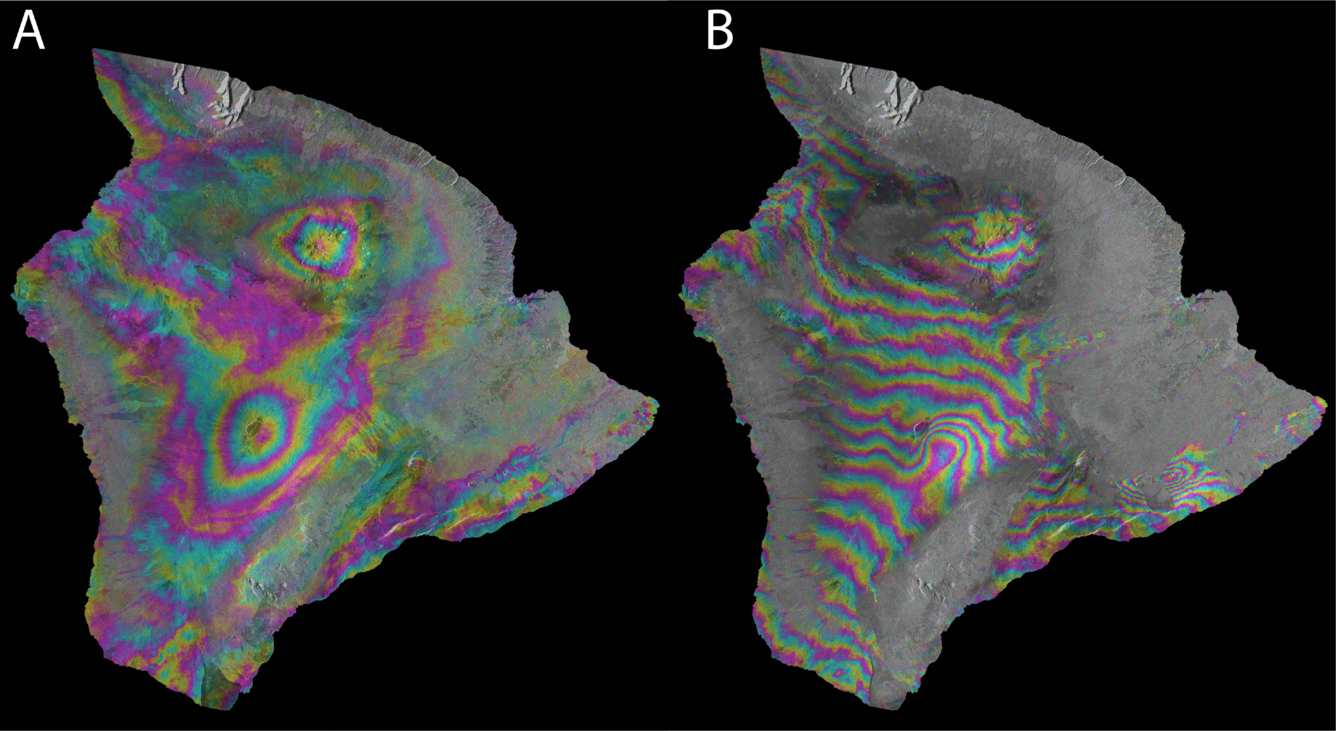
USGS images by Megan McLay, 9/7/2022. Sources/Usage: Public Domain.
InSAR scientists are trained to find hints that indicate atmospheric noise has dominated the signal. One method is visually comparing other nearby landscape features with similar topography. For example, comparing InSAR data patterns on Mauna Loa to Mauna Kea has been known to help identify and distinguish between noisy weather signals from true volcanic deformation.
At first glance, the left image above (A) could seem to show both Mauna Kea and Mauna Loa inflating at the same rate simultaneously. However, we know from our Global Positioning System (GPS) instruments that Mauna Kea shows no evidence for significant deformation, so scientists can conclude that the InSAR signals on Mauna Loa are mostly likely unreliable in this specific instance.
Likewise, GPS instruments and tiltmeters on Mauna Loa provide “ground truth” at specific points that should match the deformation shown in the interferogram. Finally, both volcanoes showing similar rates of inflation would be extremely rare, making differences in atmospheric conditions the most likely explanation.
Another method is to compare multiple InSAR images. SAR satellites capture images in both ascending (traveling northward) and descending (traveling southward) directions as they orbit the planet. By creating a second InSAR image, with the same time span, but from different SAR “look directions,” it is possible to compare two interferograms of the same event. If the deformation is real over the survey area, then both InSAR images from opposing directions would show similar rates of motion.
Hawaiian Volcano Observatory scientists are constantly using these and other tools to track the movement of magma within Hawaii’s volcanoes in order to identify the warning signs of impending eruptions.
Volcano Activity Updates
Kīlauea volcano is erupting. Its USGS Volcano Alert level is at WATCH
Over the past week, lava has continued to erupt from the western vent within Halemaʻumaʻu crater in Hawai‘i Volcanoes National Park. Sulfur dioxide emission rates remain elevated and were last measured at approximately 700 tonnes per day (t/d) on October 22. Seismicity is elevated but stable, with few earthquakes and ongoing volcanic tremor. Over the past week, summit tiltmeters recorded two deflation-inflation (DI) events.
Mauna Loa is not erupting and remains at Volcano Alert Level ADVISORY. This alert level does not mean that an eruption is imminent or that progression to an eruption from the current level of unrest is certain.
This past week, about 250 small-magnitude earthquakes were recorded below the summit and upper elevation flanks of Mauna Loa—the majority of these occurred at shallow depths less than 15 kilometers (9 miles) below sea level. Global Positioning System measurements show continued ground deformation consistent with inflation of a magma chamber beneath the summit. Gas concentrations and fumarole temperatures at both the summit and at Sulphur Cone on the Southwest Rift Zone have remained stable over the past week. Webcams show no changes to the landscape.
There were six events with three or more felt reports in the Hawaiian Islands during the past week:
- M3.3 earthquake 8 miles S of Fern Forest at 4 miles depth on Nov. 2 at 8:03 p.m.
- M2.1 earthquake 6 miles NE of Pāhala at 19 miles depth on Nov. 1 at 2:03 a.m.
- M3.9 earthquake 4 miles SSE of Waimea at 7 miles depth on Nov. 1 at 1:17 a.m.
- M3.5 earthquake 6 miles E of Pāhala at 20 miles depth on Oct. 31 at 3:38 a.m.
- M2.6 earthquake 2 miles S of Volcano at 1 mile depth on Oct. 28 at 12:16 p.m.
- M3.0 earthquake 1 mile SW of Volcano at 12 mi.es depth on Oct. 27 at 12:19 p.m.
HVO continues to closely monitor Kīlauea’s ongoing eruption and Mauna Loa for any signs of increased activity.
Volcano Watch is a weekly article and activity update written by US Geological Survey Hawaiian Volcano Observatory scientists and affiliates.
Sponsored Content