
Hawaiian Airlines Flies Record Number of Passengers in 2015
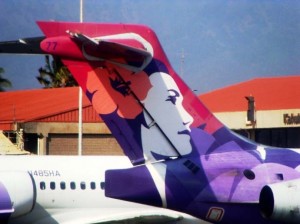
Hawaiian Airlines, photo by Wendy Osher.
Hawaiian Airlines Inc. welcomed a record 10,672,667 customers in 2015, a 4.7 percent increase over the previous year.
Hawai’i’s largest and longest-serving airline announced its system-wide traffic statistics for the full year, fourth quarter and the month of December 2015 and also updated its expectations for certain fourth quarter financial metrics (see “SYSTEM-WIDE OPERATIONS” chart below).
Hawaiian Airlines’ first 10 million passengers took nearly 40 years to carry from 1929 to 1967. In 2014, For the first time, Hawaiian welcomed 10 million guests in a year.
The record number of customers Hawaiian transported in 2015 marks 11 straight years of passenger growth as the airline expanded its network, providing travelers more options to fly between Hawai’i and Asia, New Zealand and Australia, as well as North America.
Hawaiian aslo recently announced new enhancements, including this summer’s planned launch of a redesigned premium cabin with lie-flat seating and non-stop service to Narita International Airport, as well as increased seasonal service to Neighbor Islands.
Additionally, Hawaiian added one A330-200 to its fleet in October 2015.
Hawaiian Airlines is a subsidiary of Hawaiian Holdings Inc.
SYSTEM-WIDE OPERATIONS
Includes the operations of contract carriers under capacity purchase agreements.
|
DECEMBER |
2015 |
2014 |
% CHANGE |
|
PAX |
904,647 |
876,507 |
3.2% |
|
RPMS (000) |
1,243,733 |
1,212,886 |
2.5% |
|
ASMS (000) |
1,508,217 |
1,483,789 |
1.6% |
|
LF |
82.5% |
81.7% |
0.8 pts. |
|
FOURTH QUARTER |
2015 |
2014 |
% CHANGE |
|
PAX |
2,658,269 |
2,554,350 |
4.1% |
|
RPMS (000) |
3,639,220 |
3,510,682 |
3.7% |
|
ASMS (000) |
4,391,792 |
4,269,031 |
2.9% |
|
LF |
82.9% |
82.2% |
0.7 pts. |
|
YEAR-TO-DATE |
2015 |
2014 |
% CHANGE |
|
PAX |
10,672,667 |
10,195,145 |
4.7% |
|
RPMS (000) |
14,462,191 |
13,921,147 |
3.9% |
|
ASMS (000) |
17,726,322 |
17,073,630 |
3.8% |
|
LF |
81.6% |
81.5% |
0.1 pts. |
|
PAX |
Passengers transported |
|
RPM |
Revenue Passenger Miles; one paying passenger transported one mile |
|
ASM |
Available Seat Miles; one seat transported one mile |
|
LF |
Load Factor; percentage of seating capacity filled |
Sponsored Content