Hawaiʻi Tourism Industry Sets New Records
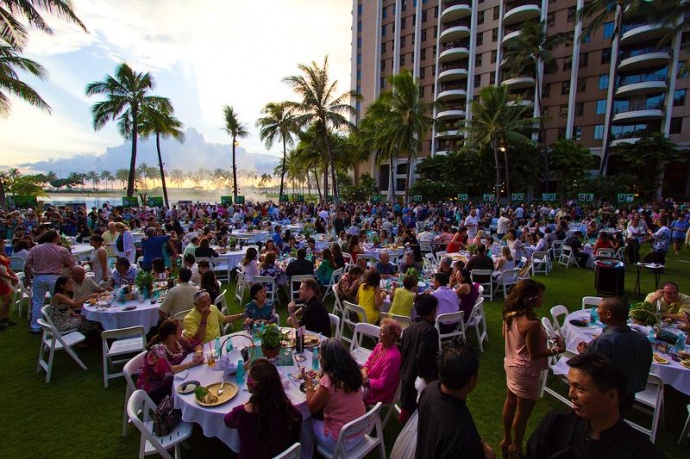
Last year’s Hawaiʻi Food and Wine Festival in Oʻahu. File photo courtesy Hawaiʻi Tourism Authority.
Hawaiʻi’s tourism industry set new records in 2016, pumping $15.6 billion into the economy and $1.82 billion into the State’s tax coffers.
The positive performance has resulted in an increase in the number of jobs supported by the visitor industry, up by 15,000 to 190,000 from the year before.
Here on Maui, visitor arrivals were up 3.9% in 2016 to more than 2.6 million visitors; and visitor spending increased 8.4% to $4.5 billion.
HTA president George Szigeti said he is hoping the agency can collaborate with industry partners and community advocates to insure that promoting tourism is balanced with the perpetuation of of Hawaiian Culture and the protection of Hawaii’s natural resources.
“Mahalo to all of tourism’s stakeholders and industry partners throughout the State for contributing to the success of Hawaiʻi’s most important industry,” he said.
Hawaii Tourism Industry Set New Records:
Hawaiʻi’s tourism industry established new records in total visitor spending and visitor arrivals in 2016, according to preliminary year-end statistics released today by the Hawaiʻi Tourism Authority. This marked the fifth straight year of record growth in both categories.
Total spending by visitors to the Hawaiian Islands increased 4.2 percent in 2016 to a new high of $15.6 billion[1].
A total of 8,941,394 visitors came to Hawaii in 2016, representing a 3 percent increase compared to 2015. On average, there were 219,625 visitors in the Hawaiian Islands on any given day in 2016, an increase of 2 percent versus 2015.
Arrivals by air rose 3.1 percent to 8,832,598 visitors in 2016, driven by growth from U.S. West, U.S. East and Korea. However, arrivals by cruise ship decreased 6.6 percent to 108,976 visitors in 2016, due to eight fewer cruise ships servicing the islands compared to 2015.
Oʻahu had a record number of visitor arrivals (+2.3% to 5,461,880) in 2016, but average daily spending was lower resulting in a slight decline in total visitor spending (-1% to $7.3 billion) compared to 2015. Maui achieved growth in both visitor arrivals (+3.9% to 2,640,175) and spending (+8.4% to $4.5 billion) in 2016. For the island of Hawaiʻi, growth in visitor arrivals (+2.3% to 1,550,046) and much higher daily spending contributed to a substantial gain in total visitor spending (+11.8% to $2.1 billion). Kauaʻi recorded growth in visitor spending (+6.3% to $1.6 billion) in 2016 boosted by a modest increase in arrivals (+1.2% to 1,187,476 visitors) and higher daily spending.
A record total of 12,020,545 air seats (+0.7%) served the Hawaiian Islands in 2016. Growth in airline seats from Other Asia (+19.9%), Oceania (+2.3%), U.S. West (+1.5%) and Canada (+0.7%) offset fewer seats from Japan (-5.8%).
For December 2016, Hawaii welcomed 828,473 visitors, a 3.6 percent increase year-over-year. Visitor spending in December 2016 totaled $1.7 billion, an increase of 5.1 percent (or $75 million) above December 2015. The statewide average daily spending was also higher (+3.1% to $198 per person) in December 2016 compared to the year prior.
Other Highlights:
- U.S. West: Arrivals increased 11 out of 12 months in 2016, resulting in total growth of 4.3 percent to 3,658,380 visitors. Arrivals from the Pacific and Mountain regions grew by 5 percent and 3.8 percent, respectively. Combined with higher daily spending (+3.2% to $167 per person), total visitor spending increased 6.2 percent to $5.6 billion. For December 2016, both visitor arrivals (+5.4% to 336,246) and spending (+7.8% to $556.1 million) rose versus December 2015.
- U.S. East: Arrivals grew 3.7 percent to 1,869,826 visitors in 2016, with increases realized from all regions. Higher daily spending (+1.8% to $201 per person) contributed to a 4.6 growth in total visitor spending to $3.8 billion. For December 2016, arrivals rose 7 percent to 183,944 visitors while spending increased 6 percent to $416 million year-over-year.
- Japan: While growth in arrivals (+0.4% to 1,488,396) was flat in 2016 compared to 2015, increased daily spending (+1.9% to $241 per person) led to a gain in total visitor spending (+2.3% to $2.1 billion). In December 2016, despite fewer visitor arrivals (-2.5% to 123,914), spending increased (+7.9% to $199.5 million) year-over-year, boosted by higher daily spending (+8.9% to $266 per person).
- Canada: Decreases in visitor arrivals (-6.5% to 478,871) and daily spending (-1.8% to $159 per person) resulted in a decline in total visitor spending (-9% to $958.1 million) in 2016 versus 2015. For December 2016, visitor spending (+3.1% $126.3 million) increased due to higher daily spending (+7.2% to $157 per person) among the 63,591 visitors (+0.6%).
Visitor arrivals from All Other International Markets increased (+6.4% to 1,337,124) in 2016 versus 2015, and the combined spending also rose (+6.4% to $3.1 billion). For December 2016, growth in arrivals from All Other International Markets (+0.3% 111,841) was flat, while combined total spending declined (-2.7% to $258.6 million), due to lower average daily spending.
- Korea: Visitor arrivals jumped (+27% to 245,857) in 2016, boosted by double-digit growth every month. For December 2016, growth in arrivals was even higher (+36.3% to 29,325). Average daily visitor spending in 2016 was $295 per person, similar to 2015.
- China: Fluctuating monthly visitor arrivals throughout the year resulted in a decrease (-2% to 170,078) for 2016. In December 2016, arrivals declined (-16.6% to 9,680) compared to the year prior. Average daily spending by visitors was down (-7% to $365 per person) in 2016 compared to 2015, but remained the highest among the visitor markets.
- Taiwan: Visitor arrivals increased (+5% to 18,410) in 2016 versus 2015. However, arrivals declined in December 2016 (-2.8% to 1,532) in contrast to December 2015.
- Australia: There were 335,753 visitors in 2016, virtually unchanged from a year ago. In December 2016, arrivals declined (-2.3% to 28,826) compared to December 2015. Visitors spent more on a daily basis in 2016 ($276 per person) compared to last year ($264 per person).
- New Zealand: Visitor arrivals were flat (+0.2% to 63,890) in 2016 compared to 2015, with decreases in the first half of 2016 offset by growth in the second half of the year.
- Europe: Visitor arrivals combined from the United Kingdom, France, Germany, Italy and Switzerland declined both in 2016 (-1.6% to 142,684) and December 2016 (-5.3% to 10,220) compared to the year prior.
- Latin America: Visitor arrivals combined from Mexico, Brazil and Argentina decreased in 2016 (-6.1% to 26,265) and also in December 2016 (-3.8% to 3,216).
[1] Total visitor spending of $15.6 billion was in nominal dollar (not adjusted for inflation) and did not include supplemental business expenditures.
Sponsored Content