Seeing the Earth Shake On Your Screen
The USGS Hawaiian Volcano Observatory , along with its partners at NOAA’s Pacific Tsunami Warning Center and the National Strong-Motion Project, operates a network of seismic monitoring stations on the Island of Hawai‘i and throughout the state.
HVO collects real-time data from these stations using computer processing software to detect, locate, and publish information about earthquakes that happen in Hawaiʻi. The data are used for cataloging of earthquakes and for assessment of earthquake, volcano, and tsunami hazards, as well as for engineering purposes, such as structural monitoring.
All seismic data are freely available to the public. How can you view these ground motion data? There are several ways. Below, we walk you through two options.
If you follow our volcano updates, chances are that you already frequent HVO’s website. The earthquake page on this website (https://volcanoes.usgs.gov/hvo/earthquakes/), by default, shows recent earthquake locations. To also see the monitoring stations, click on the tab labeled “0 Instruments Visible” on the right side of the webpage, and then click on “Seismometer” to show seismic stations. Many black triangle symbols will appear on the map, indicating the locations of seismic monitoring sites.
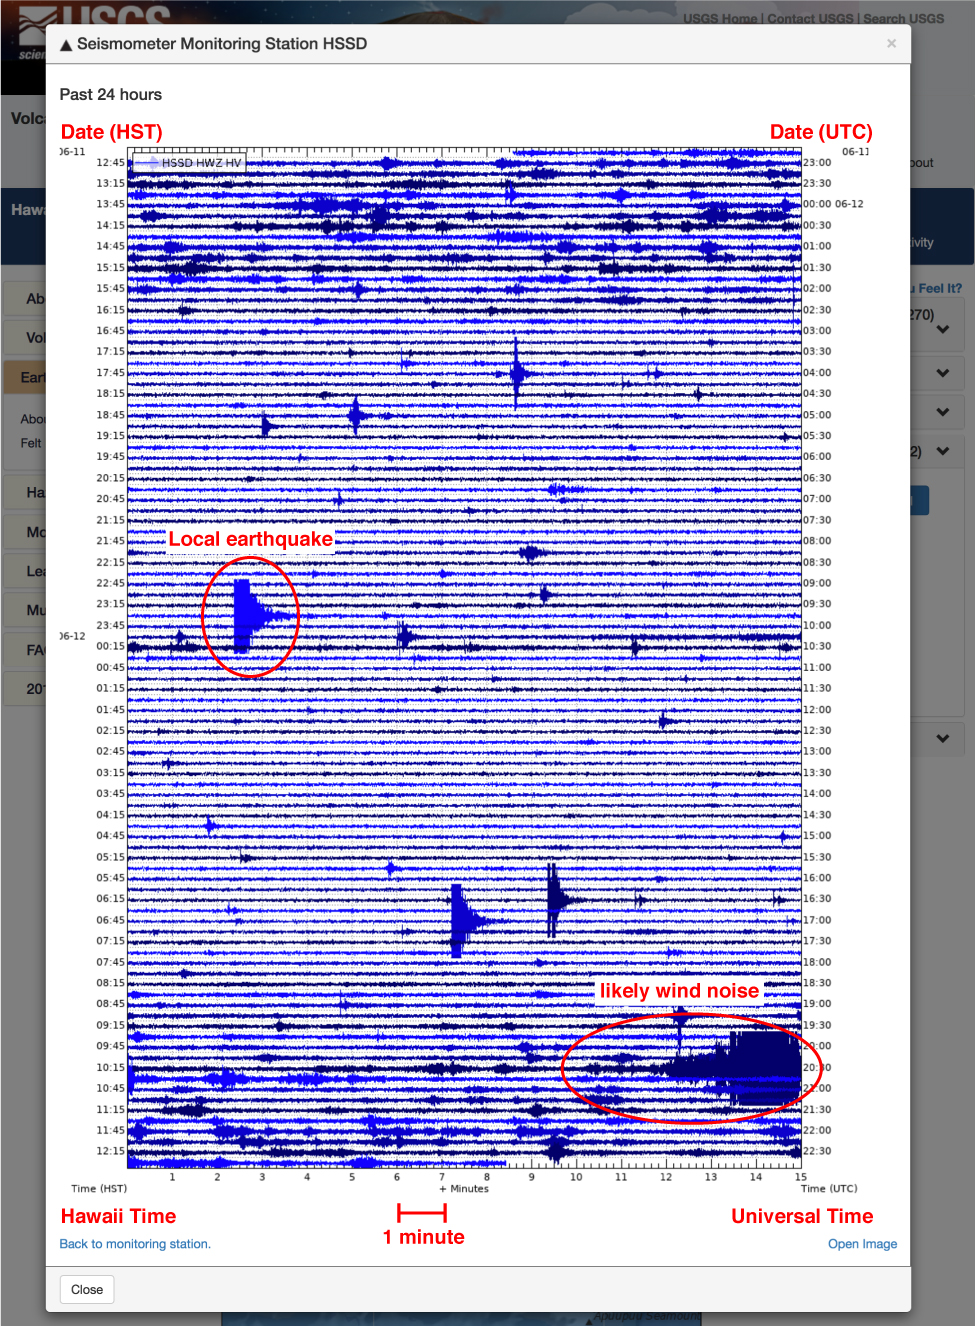
Screenshot of a seismic webicorder from the USGS Hawaiian Volcano Observatory website showing 24 hours of data from a seismic station located on the north flank of Mauna Loa Volcano. In this plot, several earthquakes are visible, along with wind noise. PC: USGS.
Clicking on a particular station symbol on the map will reveal a pop-up window that shows four panels of seismic data plots, known as webicorders, for timespans of 6 hours, 12 hours, 24 hours, and 48 hours. You can click on each timespan to enlarge the webicorder. You can also click on the “Open Image” link on the lower right corner of the pop-up window to access the image files for downloading or bookmarking. This same process applies to viewing other types of HVO monitoring data, such as that from GPS and tiltmeter instruments.
The seismic webicorder plots available on the HVO website are digital versions of the paper seismic drum recorders used in past decades. Each line shows the seismic record for 15 minutes, starting from the upper left, with the latest time in the bottom right. Thus, you read a webicorder like a book, from left to right and top to bottom. The start time of each line is shown in local time (Hawai‘i Standard Time, or HST) on the left, and the end time of each line is shown in Coordinated Universal Time (UTC) on the right.
Seismic data are shown in blue on webicorder plots, with each 15-minute span alternating between dark- and light-blue tones. The blue lines mimic ground motion under the seismic sensor: the line moves up if the ground shifts upwards, the line moves down if the ground moves downwards, and the line would be flat at “zero” if no ground motion is detected. The higher the amplitude of the ground motion, the taller the blue line will be. What is immediately apparent is that the ground is always moving up and down ever so slightly.
Seismic instruments are very sensitive and record anything that shakes the ground. So, wiggles on webicorder plots could be a record of wind, thunder, lightning, ocean waves crashing against the island, as well as of localized shaking from rockfalls, quarry blasts, or other explosions.
Earthquakes appear as blue smudges that often resemble a sideways tornado. Each has certain recognizable characteristics, including P- (primary) and S- (secondary or shear) waves, which may have a sharp onset and then decay to background level. Greater separation between P and S waves indicate increasing distance from the seismic station to the earthquake. Other types of earthquakes, for example those due to the movement of magma or gas, look different, generally with longer period energy that can persist over longer time frames.
Another way to find seismic data online is through the Incorporated Research Institutions for Seismology website. IRIS is the world’s repository for seismic data, including HVO’s. IRIS offers many ways to find, view, and download data for various purposes. One of the easiest and most convenient methods is with the IRIS Station Monitor tool (https://www.iris.edu/app/station_monitor/), which can be accessed in a website browser or in apps available for iOS and Android devices.
For more tips on reading webicorders, check out this informative USGS video:
Volcano Watch is a weekly article and activity update written by US Geological Survey Hawaiian Volcano Observatory scientists and affiliates.
Volcano Activity Updates
Kῑlauea Volcano is not erupting and its USGS Volcano Alert level remains at NORMAL. For definitions of USGS Volcano Alert Levels, see https://volcanoes.usgs.gov/vhp/about_alerts.html.
Rates of deformation, gas release, and seismicity on Kīlauea have not changed significantly over the past week.
Since early March, GPS stations and tiltmeters at Kīlauea’s summit have recorded deformation consistent with slow magma accumulation within the shallow portion of the summit magma system. However, gas measurements have not indicated shallowing of large volumes of magma.
On Kīlauea’s East Rift Zone, GPS stations and tiltmeters continue to show motions consistent with refilling of the deep magmatic reservoir in the broad region between Puʻu ʻŌʻō and Highway 130. This trend has been observed since the end of the 2018 eruption, although there is an indication that this motion has been slowing down over recent weeks.
Sulfur dioxide emission rates on Kīlauea’s ERZ and summit remain low, but HVO continues to closely monitor gas emissions in both areas for any changes.
One earthquake with three or more felt reports occurred in Hawaiʻi this past week: a magnitude-2.8 quake beneath Captain Cook at 11 km 7 mi) depth on June 6 at 3:02 a.m. HST.
Hazards remain at the lower ERZ and summit of Kīlauea. Residents and visitors near the 2018 fissures, lava flows, and summit collapse area should heed Hawai‘i County Civil Defense and Hawaiʻi Volcanoes National Park closures and warnings. Hawaiʻi County Civil Defense advises that lava flows from the 2018 eruption are primarily on private property; people are asked to be respectful and to not enter or park on private property.
The USGS Volcano Alert level for Mauna Loa remains at NORMAL. A slight increase in detected earthquakes was noted over the past month. GPS instruments show slow inflation of the summit magma reservoir. Gas and temperature data showed no significant changes the past month.
HVO continues to closely monitor both Kīlauea and Mauna Loa for any signs of increased activity.
Please visit HVO’s website (https://volcanoes.usgs.gov/hvo) for past Volcano Watch articles, Kīlauea and Mauna Loa updates, volcano photos, maps, recent earthquake info, and more. Call 808-967-8862 for weekly Kīlauea updates. Email questions to askHVO@usgs.gov.
Sponsored Content