
Report: 54% of Hawai‘i’s Population Was Born Here
The state Department of Business, Economic Development and Tourism released a report, “Demographic, Social, Economic, and Housing Characteristics for Selected Race Groups in Hawaiʻi,” which shows the different life styles among 14 race groups in Hawaiʻi.
Maui Now graphic
“We have the most diversified culture, work force, and life style among all the states in the nation,” said DBEDT Director Luis P. Salaveria. “This gives us an advantage in terms of international trade and tourism by supplying the diversified work force and providing a wide variety of food and cultural activities. At the same time, there are more demand for government and private services, especially in the areas of education and health care.”
Chief State Economist Dr. Eugene Tian noted that the Pacific Islander groups (Samoan, Marshallese, Guamanian or Chamorro, and Tongan) have significantly larger household sizes, higher poverty rates, higher unemployment rates, lower home ownership, and lower per capita income. Population in these groups are the youngest in the state.
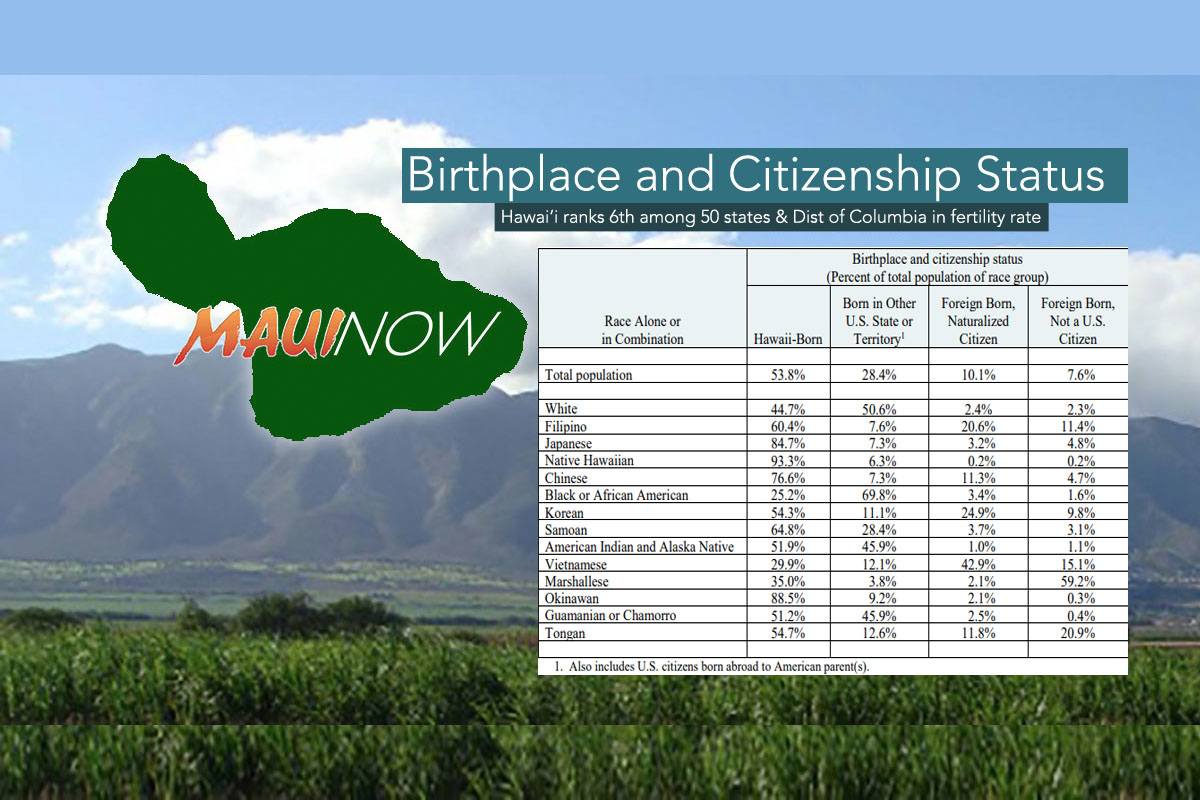
The report highlighted information about social characteristics and birthplace:
ARTICLE CONTINUES BELOW ADARTICLE CONTINUES BELOW ADA total of 53.8% of the population was born in Hawaiʻi. Others likely came to be reunited with family, for higher education, or for work and job opportunities, as 399,893 people, or 28.4% of the population, were born in another state or US territory and 249,319 people, or 17.7% of the total population, are foreign born. The diverse backgrounds from which Hawaii residents come enrich the culture with unique traditions and languages, and may provide insights about the connections Hawaii has to the wider global economy.
The islands’ fertility rate was also detailed:
The average births per year during the 2011-2015 period was 20,257. (The American Community Survey estimates are based on survey data, and thus the average births per year may differ from sources which use administrative records to track births.) Hawaiʻi ranks 6th among the fifty states and District of Columbia in terms of fertility rate. (Fertility rate is the number of women 15 to 50 years old who had a birth in the past 12 months per 1,000 women 15 to 50 years old.) An estimated 43.9% of births were given by women who were at least partly White, 28.5% of births were to Filipino or part-Filipino women, and 24.8% were to Native Hawaiian or part-Native Hawaiian women.
The report also detailed income among the different groups:
The median household income in Hawaiʻi was $69,515 during the 2011-2015 period, which ranked Hawaiʻi 6th among the 50 states and District of Columbia and 29.0% greater than the US average. Five race groups have median household incomes which are greater than the state average: the Filipino, Japanese, Chinese, Okinawans, and Guamanians or Chamorro.
The same five race groups also have median family incomes which are greater than the state average of $80,778. However, only Whites, the Japanese, and Okinawans have a per capita income greater than the state average of $29,822.
ARTICLE CONTINUES BELOW ADPer capita income in Hawaiʻi, while still greater than the US average, ranks 19th among the 50 states and the District of Columbia. This suggests that household structure plays a role in Hawaii’s high median household income and median family income. Hawaiʻi ranks first in the nation for multigenerational families and second in household size. More adults in the home means that more people can contribute to the household income and financial upkeep of the home.
Some highlights from this report include the following:
-
-
- Nearly a fourth, 23.7% of Hawaiʻi’s population identified as multiracial during the 2011-2015 period while the share of multiracial population in the US was 3% during the same time period.
- The top five “race alone or in combination” groups were as follows: White (43%) Filipino (25%), Japanese (22.1%), Native Hawaiian (21.3%) and Chinese (14.1%). An estimated 57% of the total population was non-white.
- The median age in Hawaiʻi was 38-years-old. Of the groups studied, Japanese had the oldest median age at 43.9 years, and the Marshallese had the youngest median age at 18.5.
- 53.8% of the population living in Hawaiʻi during the 2011-2015 period were born in Hawaiʻi. Native Hawaiians had the largest share of native-born population. The Marshallese had the largest share of foreign-born population.
- An estimated 33.5% of all households had at least one child living in it, and an estimated 32.5% of households had at least one person 65 or older living in it.
- More than 95% of the White, Japanese, Black or African American, and Okinawan populations in Hawaiʻi had at least a high school diploma during the 2011-2015 period.
- Blacks or African Americans aged 16 and older had the highest rates of labor force participation in Hawaiʻi. Okinawans had the lowest civilian unemployment rate during the 2011-2015 period.
- One-tenth, 10.4% of civilian workers in Hawaiʻi were self-employed during the 2011-2015 period. The Vietnamese had the highest rates of self-employment.
- The median household income in Hawaiʻi was $69,515. Of the top five largest race groups in Hawaiʻi, Filipinos had the highest household income and Native Hawaiians had the lowest.
- An estimated 7.7% of families in Hawaiʻi lived in poverty during the 2011-2015 period. An estimated 11.2% of all people in Hawaiʻi lived in poverty.
- Homeownership rates in Hawaiʻi were among the lowest in the nation. An estimated 56.9% of homes in Hawaiʻi were owner occupied while the US home ownership was 63.9%. Only three race groups had homeownership rates greater than the national average: Okinawans (77.3%), Japanese (73.6%) and Chinese (64.1%).
The statistics in the report are based on the data from the US Census Bureau’s 2011-2015 American Community Survey, special tabulation by race groups, and this data set is the latest available for the selected race groups.
-
Sponsored Content