

Hawai‘i Data Book: 42% of Maui Home Sales go to Mainland Buyers
The Department of Business, Economic Development and Tourism released the 2016 edition of the “State of Hawaii Data Book” on Wednesday.
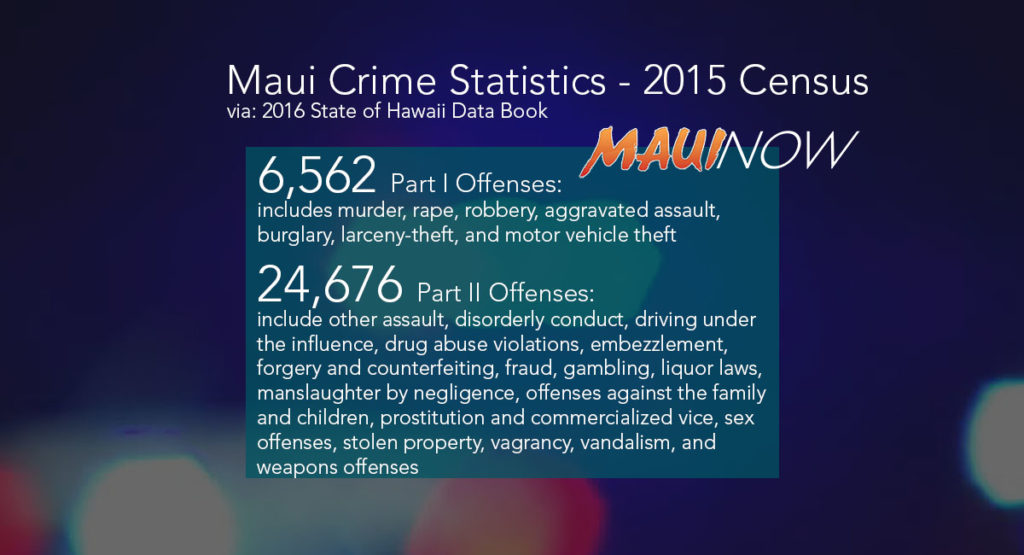
Maui crime stats Part 1 & II. *via 2016 State of Hawaiʻi Data Book. Click to view in greater detail.
The Data Book has more than 800 data tables and covers a broad range of statistical information in areas such as population, education, environment, economics, energy, business enterprises, government, tourism and transportation, making it the most comprehensive statistical book about Hawaiʻi in a single compilation.
“The Data Book has been around for 48 years and provides useful information related to Hawaiʻi in a variety of areas including research, business planning, and policy design,” said DBEDT Director Luis P. Salaveria. “The Data Book is the most popular item on the DBEDT website.”
“Though we compile the book around the middle of August every year, we update the tables year round,” said State Economist Dr. Eugene Tian. “We also try to add any valuable data in the book when they become available and abolish data when obsolete. One of the tables we added this year is the federal government grants to state government, and note that most of the grants were allocated based on population and the numbers presented in Table 9.61.”
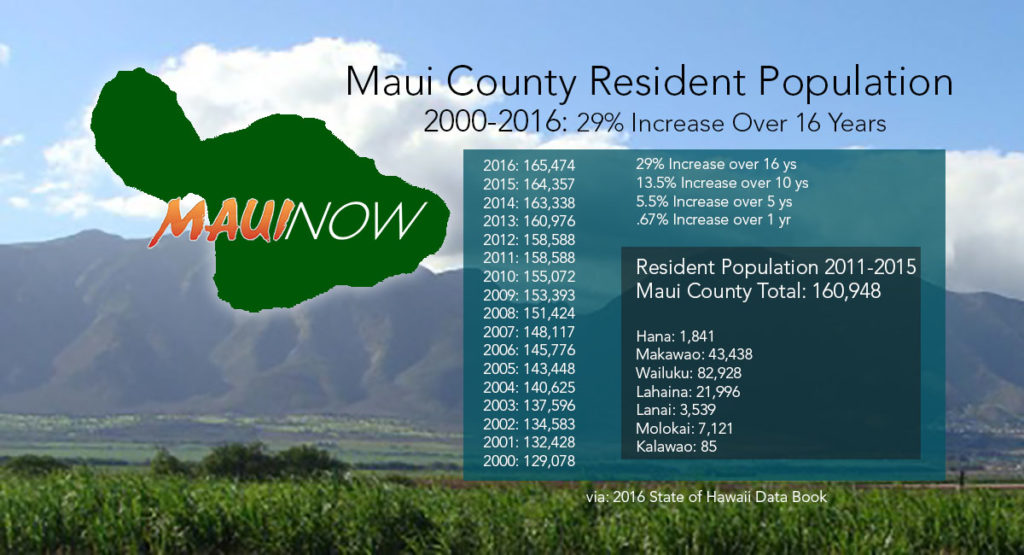
Maui County resident population stats. Data *via 2016 State of Hawaiʻi Data Book. Click to view in greater detail.
Some highlights in the newest edition show that:
· Maui County’s resident population increased by 1,117 people from 2015 to 2016. The total as of July 1, 2016 was estimated at 165,474 and includes Kalawao County (Kalaupapa Settlement). The population there was 147 in 2000, 90 in 2010 and 88 in 2016.
· As of July 1, 2016, there are 717,615 males living in the state and 710,942 females.
· In 2015, about one out of every six people arrested for an index offense (such as murder, rape, robbery, larceny-theft, motor vehicle theft) was a juvenile offender. (Table 4.08)
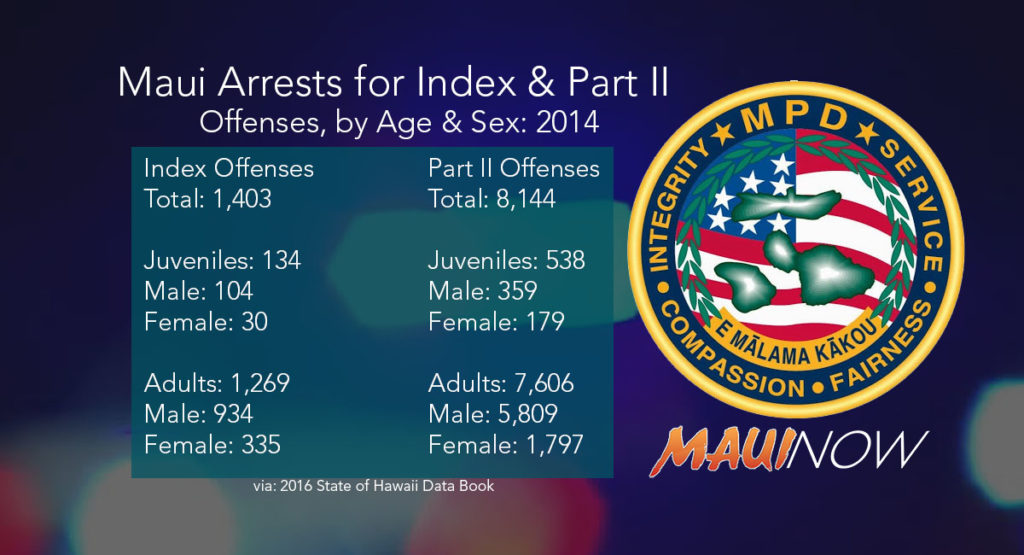
2014 Maui arrests. *via 2016 State of Hawaiʻi Data Book. Click to view in greater detail.
· There were 6,562 Index Offenses reported in Maui County in 2015. The Index Offenses reported in Maui County in 2005 was 8,615.
· There were 166 juveniles in Maui County that were arrested for Index Offenses in 2015, 139 were male and 27 were female. For adults in Maui County, 1,321 were arrested for Index Offenses, 936 were male and 385 were female. (Table 4.08)
· Part II data includes all other offenses, except traffic i.e. other assault, disorderly conduct, DUI, drug abuse violations, embezzlement, forgery, gambling, liquor laws, manslaughter by negligence, sex offenses, stolen property, vandalism and weapons offenses, to name a few. In Maui County, 8,208 individuals were arrested for Part II Offenses, 425 were juveniles.
· Across the state, there were 29 murder offenses; 1,085 robberies; 1,878 aggravated assaults; 6,810 burglaries; 33,140 larceny-theft; and 5,439 motor vehicle thefts in 2015.
· The top five places of birth for the foreign-born population in Hawaiʻi were the Philippines, Japan, China (excluding Hong Kong and Taiwan), Korea and Vietnam based on data from 2011 to 2015. (Table 1.45)
· There were 18,461 babies born in Hawaiʻi in 2015, the most common girl name was Mia and the most common boy name was Noah. (Table 2.08)
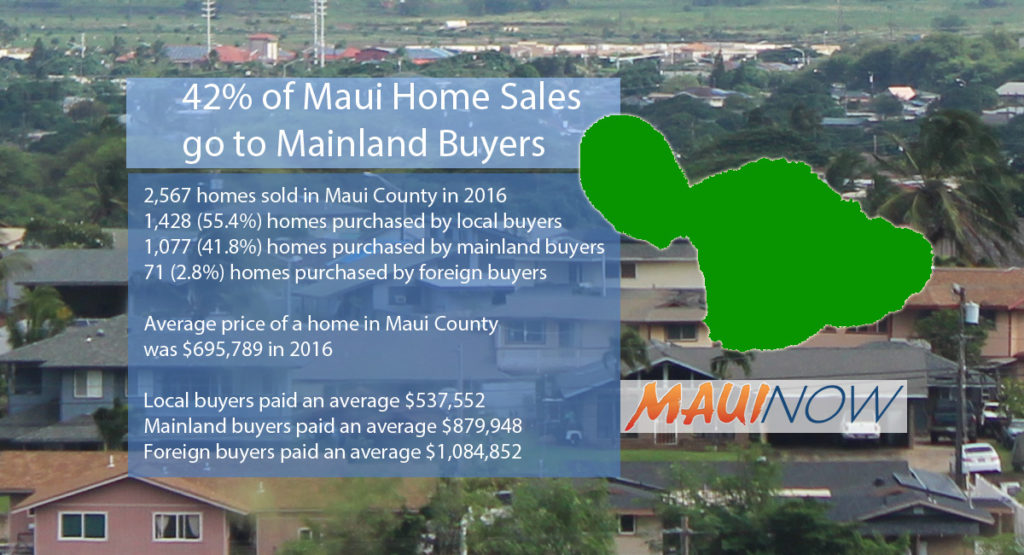
Maui Now graphic. *via 2016 State of Hawaiʻi Data Book. Click to view in greater detail.
· There were 2,576 home sales in Maui County in 2016; 1,428 were local buyers; 1,077 were mainland buyers; and 71 were foreign buyers. The average home price for locals in 2016 in Maui County was $537,552; $879,948 for mainland buyers; and $1,084,852 for foreign buyers. (Table 21.39)
· Maui has the highest median sales price of condominium sales in the state, and has been the highest since 2008. The median condo sales price in Maui County in 2016 was $415,000. (Table 21.36)
· California was the top state of in-migrants (about 10,950) to Hawaiʻi and out-migrants (about 10,500) from Hawaiʻi in 2015. (Tables 1.69 and 1.70)
· In 2015, more than half of the 7,500 licensed beds in state-approved facilities were in long-term care facilities, while the remainder of the beds were in acute care and specialty care facilities. (Table 2.25)
· The enrollment at the University of Hawaiʻi dropped in 2016. Total enrollment at University of Hawaii campuses was 53,418; a 4.2% decrease from 2015, and the lowest total enrollment since 2007. (Table 3.23)
· A little over two in every three containers purchased have been redeemed since the introduction of the beverage container redemption program in 2006. The highest redemption rate occurred in 2009 at 78.7% and the lowest rate in 2016 at 66.9%. (Table 5.33)
· In 2015, there were 256,912 social security beneficiaries in the State of Hawaiʻi who were paid estimated annual benefits totaling 3.8 billion dollars; both numbers were the highest recorded figures for the state. (Table 11.11)
· The private employer with the largest number of employees in 2016 was the Queen’s Health System with 7,455 employees. The second was Marriott Hawaiʻi that had 6,929 employees. (Table 12.15)
· Hawaiʻi’s household debt per capita was $68,500 in 2016, 46% higher than the US average in the year. It was the highest among the 50 states, but lower than the District of Columbia at $81,200 in the year. (Tables 13.42 and 13.44)
· Hawaiʻi had three banks, which had assets of more than $1 billion each and these banks employed a total of more than 5,000 people in 2016. (Table 15.04)
· Bus fares have remained unchanged for 7 years. Since July 1, 2010, an adult one-way cash fare has remained at $2.50 and the youth fare at $1.25. (Table 18.26)
· Overseas passenger arrivals and departures both have exceeded 10 million in 2016 for the first time in history with arrivals at 10,223,372 and departures at 10,241,737. (Table 18.36)
· In 2012, 689 principal operator farmers were Native Hawaiian or other Pacific Islanders alone, making up 9.8% of the total. 2,824 principal operator farmers were Asian alone (40.3% of total), and 2,749 were White alone (39.3% of total). (Table 19.06)
· In 2016, 18,124 acres of forest and brush land were burned. Two cases of arson burned 5,801 acres, and two cases of equipment fires burned 4,701 acres. Previously, the last recorded equipment fire was 2011, and the last recorded case of arson was 2010. (Table 20.03)
· Over the past 10 years, Hawaiʻi’s foreclosure filings went from a low of 453 in 2006 to a high of 3,422 in 2013 and is now at 1,734 in 2016. (Table 21.40)
· International students in Hawaiʻi were estimated to have spent $225.3 million on living expenses, tuition and fees in the 2016/17 school year. The estimated direct, indirect, and induced impact of their spending on Hawaiʻi’s economy was more than 5,000 additional jobs and an additional $484 million in output. (Table 24.12)
The book is in electronic form and is available on the DBEDT website and may be downloaded in whole or in part as either PDF or Excel files.
Sponsored Content