RAM: Condo and Land Sales Increase in February 2016
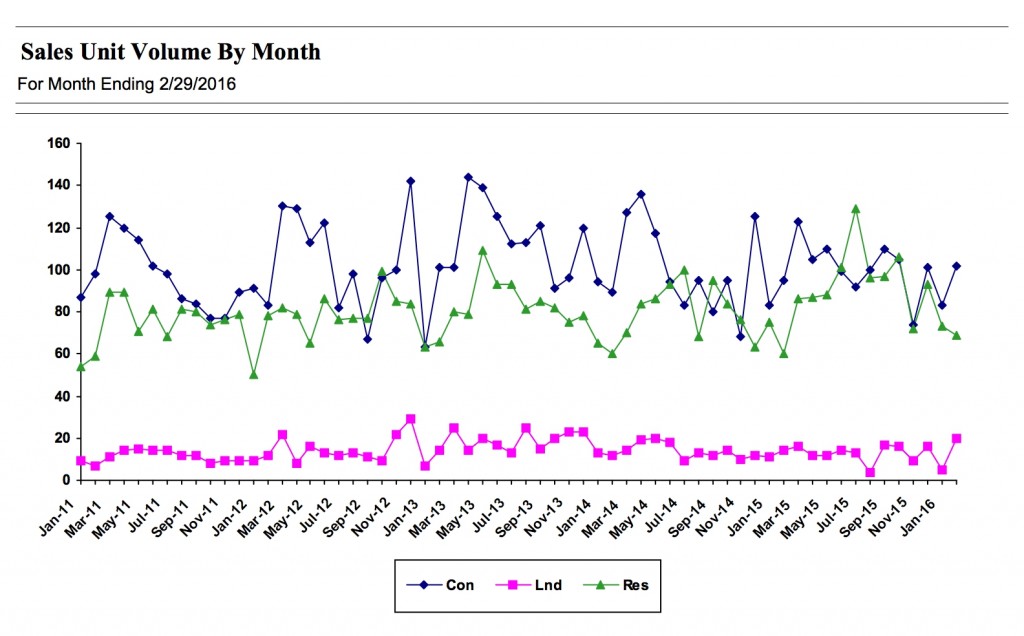
RAM sales unit volume by month. RAM graphic.
During February 2016, the Realtors Association of Maui reports that condo unit and land lot sales numbers rose significantly.
In February, condominium sales increased to 102 units sold, land sales increased to 20 lots sold and residential sales declined to 69 homes sold.
The residential median price decreased to $595,000, land median price decreased to $521,500, and the condo median price increased to $444,450.
Well-priced properties are attracting multiple offers, making for quick sales.
While general US economic news looks cautiously hopeful, current world and US events will have ripple effects on cost of living, consumer confidence, financial and real estate markets.
Canadian investors have been big participants in Maui’s real estate market in years past; however, the current Canadian dollar exchange rate (one Canadian dollar equals .75 US dollars) may motivate Canadian investors to sell rather than buy.
RAM says “cash is king” when making an offer. Savvy investors are buying with cash, giving them a strong negotiating position, no financing/appraisal hassles and a quick closing. For several months approximately 37% of all sales were cash.
REO (foreclosures) and short sales are dwindling, with any “hidden inventory” (or overhang) backlog slowly trickling onto the market.
Mortgage interest rates are inching up slightly which may help motivate would-be buyers to proceed—if they can qualify.
Rising sales prices are causing some owners to their homes on the market.
TIPS FOR POTENTIAL SELLERS
- Tals to your CPA and your Realtor to explore the hidden benefits or consequences of putting your property on the market. Make no assumptions that will sting later.
- To be successful, sellers need to beat competing properties with better property condition, realistic pricing, good marketing and flexible, creative terms.
- Days-on-market figures show that properties priced right will sell in a reasonable timeframe, often with multiple offers. Pricing right is still the determining factor.
- The best deals are selling, while significantly over-priced listings remain un-sold.
- Pro-active sellers are getting their properties appraised, inspected and surveyed in advance to encourage realistic offers from knowledgeable buyers. This can prevent unanticipated escrow fallout and can help prevent buyers from negotiating on the sale price during the transaction, when previously unknown facts come to light.
TIPS FOR POTENTIAL BUYERS
- Low interest rates prevail, but have started to nudge up.
- Buyers should get pre-approved so they can shop in confidence (fewer last minute disappointments due to non-funding loans).
- Short sales and foreclosures are still in the marketplace, yet they can be less of a bargain than they seem, presenting more hurdles to leap and requiring more time to close (often four to 12 months), if at all.
- Lenders’ requirements for loan approval are more stringent now, compared to 2004-08.
- Many first-time home-buyer programs are available in which attendees can familiarize themselves with the process and get qualified/approved.
- The low point in the market has passed, so check it out carefully now without delay. The opportunity is fading quickly.
- If you can’t buy now, start saving your down payment for the next market cycle.
Disclaimer: Zooming in on the figures of a specific geographic area or property type may lead to different conclusions that looking at the overall view. Maui’s market place is much smaller than O‘ahu’s and a few high or low sales have a greater effect on the statistical numbers without necessarily indicating a big market swing one way or another.
Overview of the full RAM report for February 2016
Days on Market Residential homes = 156, condos = 98, land = 192.
(General DOM note: this is the average DOM for the properties that sold. If predominantly old inventory sells, it will move this indicator upward, and vice versa. RAM’s days-on-market statistics are calculated from list date to closing date (not contract date), including approximately 60 days of escrow time.) Page 6
February’s Year-to-Date Sales Numbers compare only January and February 2016 to January February 2015. Shorter timeframe (monthly) views do not necessarily reflect the longer timeframe trends. Pages 10–14
Residential unit sales increased (142 homes sold / +7 units / +5% change YTD), average sold price = $828,747 (+8% change YTD), median price = $609,000 (+7% change YTD) and total dollar volume sold = $117,682,111 (+13%YTD).
YTD condo unit sales increased (185 units sold / +7 units change/ +4% change YTD), average sold price = $590,630 (-6% change YTD), median price = $405,000 (-8%YTD). Total condo dollar volume sold = $109,266,496 (-3% change YTD).
YTD land sales quantity exactly matches January-February 2015’s YTD (25 lots / 0 units change / 0% YTD change), average sold price = $619,934 (-12%), median price = $515,000 (-6%), Total dollar volume = $15,498,361 (-12% YTD).
Note that land lot sales are such a small sampling that statistics in this property class are not necessarily reliable indicators. Big percentage changes may be misleading or misunderstood so be careful.
For a more comprehensive view, see 2015’s year-end (Dec. 2015) figures.
TOTAL SALES FOR PAST 12 MONTHS
Residential = 1,032 (with 11.6% being REO or SS)
Condo = 1,206 (5.9% REO or SS)
Land = 154 (3.2% REO or SS).
NOTE: 35.7% of these sales in the last 12 months have been cash transactions.
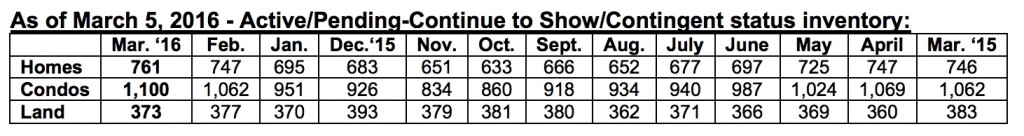
Current Absorption Rate base on this month’s active/pending-continue to show/contingent status
inventory divided by February sales: residential = 11 months, condo = 10.8 months, land = 18.7 months of inventory.
Sponsored Content