Maui County unemployment holds steady in May, remains below 2024 levels
Maui County’s seasonally adjusted unemployment rate continued to hover around 3% during the month of May, according to data released by the Hawai‘i State Department of Business, Economic Development and Tourism on Monday.
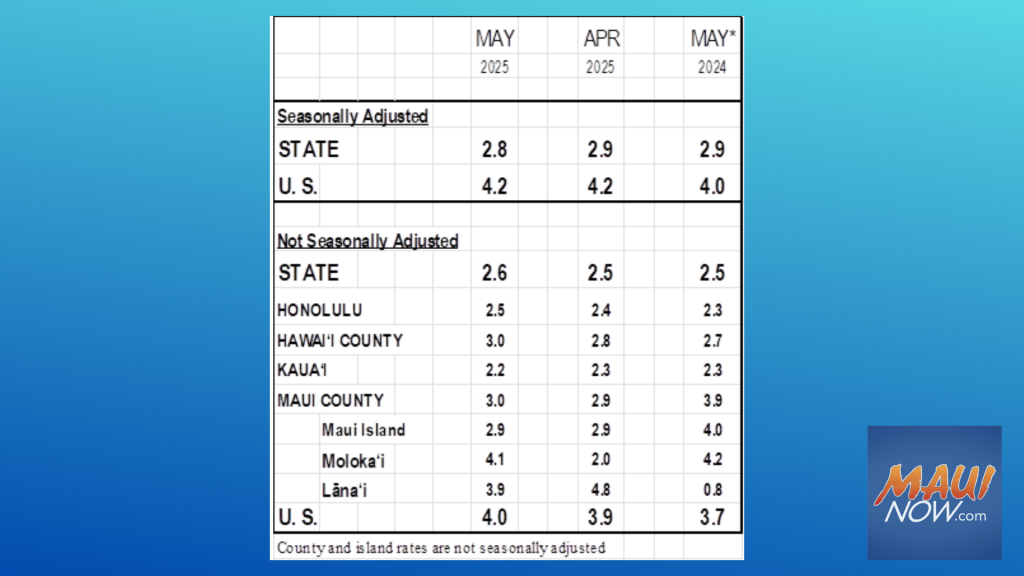
The data showed 78,550 Maui County residents were employed in May, while 2,400 were unemployed, resulting in an unemployment rate of about 3%. The rate remains well below the 3.9% unemployment recorded one year before, in May 2024, due to a smaller labor force and 500 more jobs filled than one year earlier.
Maui Island itself maintained a 2.9% unemployment rate for the second consecutive month, continuing its trend of gradual improvement from the 3.4% rate at the start of 2025. One year ago, unemployment on Maui Island stood at 4.0%.
On the other islands of Maui County, conditions were more volatile in May. Moloka‘i experienced the sharpest month-to-month increase in the state, with unemployment rising from 2% in April to 4.1% in May—now the highest rate among all Hawaiian Islands (data for Niʻihau is not collected). In contrast, Lāna‘i saw its unemployment rate drop from 4.8% in April to 3.9% in May.
DBEDT also reported the county’s civilian labor force decreased by 1,000 residents in May compared to April. The number of employed people in the county also dropped by about 1,000 from April to May.
State and national trends
Statewide, Hawai‘i’s seasonally adjusted unemployment rate was 2.8% in May, slightly down from 2.9% in April. A total of 669,350 people were employed, while 19,500 were unemployed, yielding a seasonally adjusted labor force of 688,850. Nationally, the seasonally adjusted unemployment rate held steady at 4.2% for the third straight month.
The not-seasonally adjusted unemployment rate for Hawai‘i was 2.6% in May, compared to 2.5% in April.
Total nonfarm payroll jobs in Hawai‘i increased by 700 positions in May. Leading job gains occurred in:
- Leisure & Hospitality: +1,000 jobs
- Private Education & Health Services: +400
- Construction: +300
- Financial Activities: +200
Within Leisure & Hospitality, the rise in employment was driven largely by gains in Food Services and Drinking Places, continuing a trend seen over the past three months.
Job losses were reported in:
- Professional & Business Services: -700 (primarily in Professional, Scientific & Technical Services)
- Trade, Transportation & Utilities: -600
- Manufacturing and Information: -100 each
Government employment increased by 300 jobs.
Year-over-year, the state added 13,900 nonfarm jobs, a 2.2% increase from May 2024.
BLS and DBEDT will release the next monthly report in mid-July. For more detailed statistics and historical comparisons, access the state Labor Market Dashboard here.
Sponsored Content